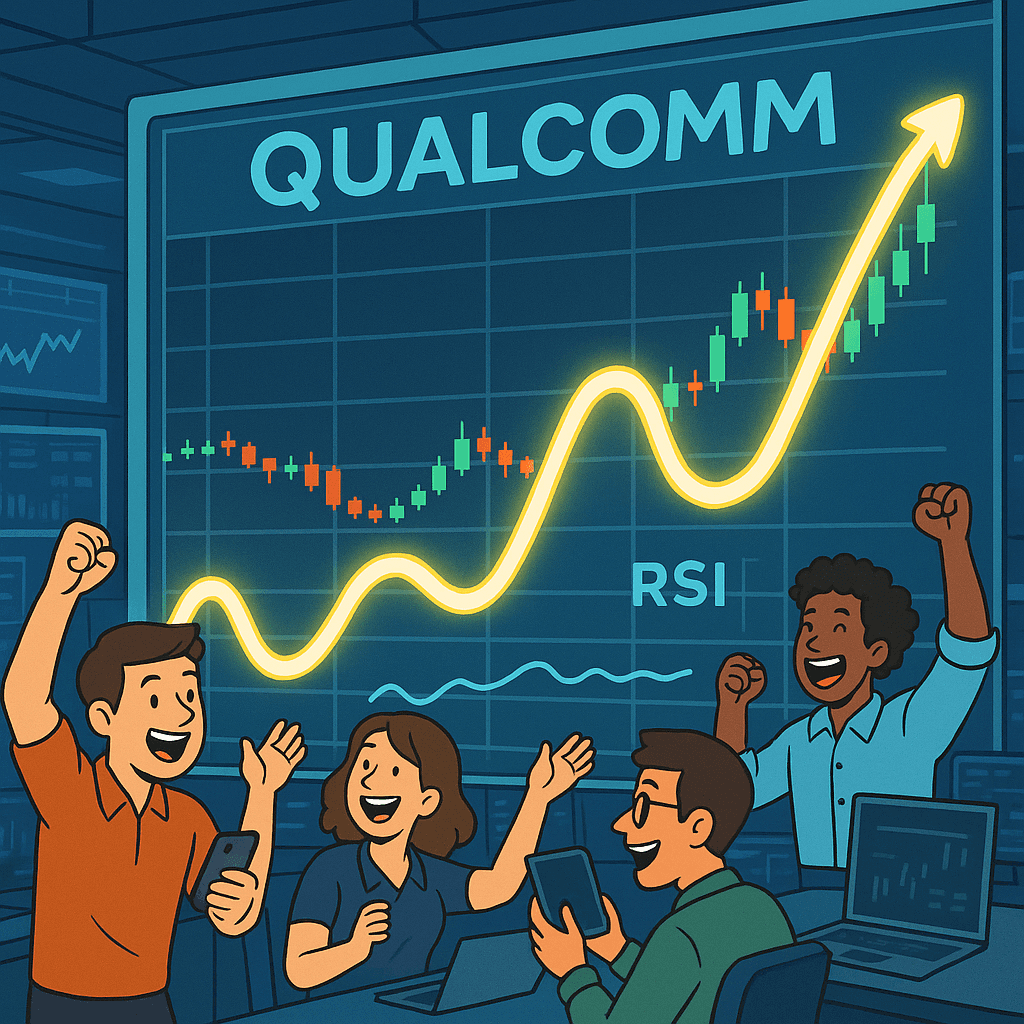
Qualcomm’s Relative Strength Index has once again gone full manic pixie dream stock, prompting analysts to dust off that one chart from 2019 they’ve been recycling ever since. According to Investing.com, in the piece titled “Qualcomm: The Last Time Its RSI Did This, the Stock Rallied 70%,” the chip giant’s RSI is now doing that thing again — the thing that makes traders forget risk exists and start Googling “what is a margin call” after the fact. (Investing.com, Jan 2026)
For the uninitiated, the Relative Strength Index, or RSI, is a momentum oscillator lovingly used by chart enthusiasts who believe history repeats itself, mostly because that’s the only way their PowerPoint slides still matter. In Qualcomm’s case, the last time the RSI looked like this, the stock allegedly went on a 70% joyride, which has now been promoted from “fun historical fact” to “religious doctrine” on r/wallstreetbets and TikTok FinTok.
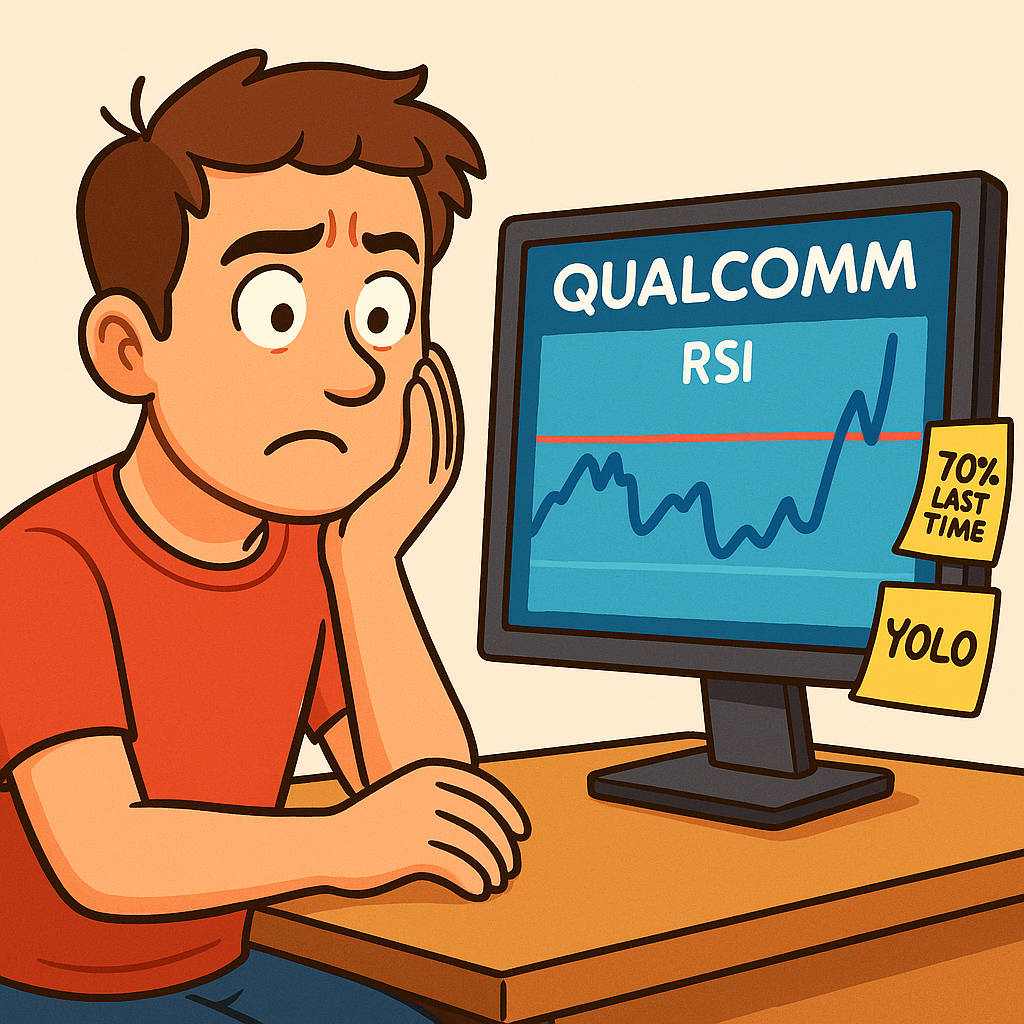
“The pattern is clear,” insisted one retail trader who asked to be identified only as “QCOMChad420,” speaking from a Discord voice channel filled with the sound of mechanical keyboards and slowly dying dreams. “Back then RSI did this, Qualcomm pumped 70%. Now RSI did this again. Ergo, I have pre-spent my future gains on a PS6, three NFTs of pixelated Qualcomm logos, and tickets to an AI conference in Dubai. It’s called financial planning.”
Meanwhile, actual adults in suits are trying to pretend this is all very scientific. Qualcomm, which still makes the Snapdragon chips inside your phone that you only think about when it overheats playing crypto games, is being dressed up as a pure technical trade instead of what it really is: a company caught in the crossfire of 5G, AI on-device hype, and your roommate refusing to upgrade his six-year-old Android because “it still works.”
“Look, the last time the RSI behaved like this, Qualcomm did in fact rally around 70%,” said a fictional-but-plausible analyst at a major Wall Street firm, speaking on condition of anonymity because compliance “gets weird” when you say the quiet part out loud. “But back then, the macro backdrop, interest-rate environment, handset cycle, 5G rollout, AI narrative, and liquidity conditions were all different. So we’ve run the numbers carefully and concluded that, uh, yeah, we’re just going to show the 2019 chart again on TV and hope nobody asks follow-ups.”
In a move that shocked absolutely no one, financial influencers have already turned the Investing.com article into scripture. Clips titled “QUALCOMM 70% RUN CONFIRMED” and “RSI GLITCH IN THE MATRIX” are now trending, starring creators who explain technical analysis by drawing colored arrows on TradingView and calling it “quant work.” One particularly viral video shows an influencer circling Qualcomm’s RSI spike with the caption: “Last time this happened, boom. Now it happened again. Do you hate money?”
The logic is breathtakingly simple:
- Step 1: Find indicator that worked once.
- Step 2: Wait for indicator to reappear.
- Step 3: Ignore earnings, competition, regulation, and reality.
- Step 4: Assume 70% upside, no downside, and early retirement.
Qualcomm itself has remained politely silent about the RSI circus, presumably because its legal department has already yelled “we don’t comment on technical analysis” enough times to wear grooves in the conference room table. Insiders say executives in San Diego are torn between enjoying the share-price bump and worrying that their multi-billion-dollar chip roadmap is now being valued with the same methodology used to trade dog-themed cryptocurrencies.
“We spent years building foundational technology for global connectivity and AI at the edge,” a hypothetical Qualcomm PR spokesperson might say. “But sure, let’s just base our market cap on the angle of a purple line measured over 14 trading sessions. That seems stable.”
The irony for Qualcomm investors is that there are real fundamentals in play: continued 5G adoption, AI accelerators baked into Snapdragon platforms, licensing revenue from half the planet’s smartphones, and the ongoing arms race to make your phone’s camera good enough that you no longer need human friends. But why discuss design wins and unit volumes when “RSI 30 → moon” fits better on a YouTube thumbnail?
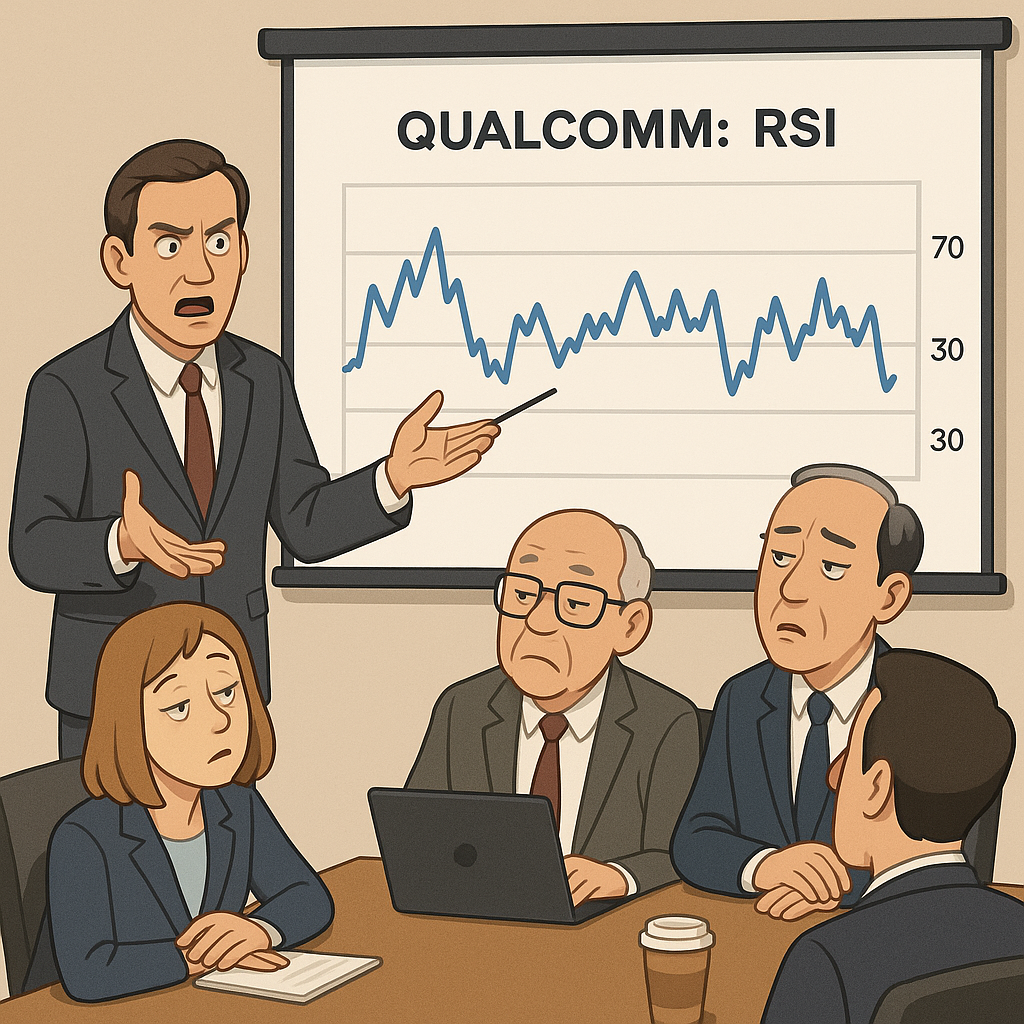
Traditional portfolio managers, staring down their Bloomberg terminals and suppressed emotions, are not thrilled to see their Qualcomm thesis reduced to meme momentum. One fund manager in New York summed it up: “We built a 40-page model on margins, ASPs, and TAM expansion. Our CIO skimmed it, nodded, then asked, ‘But is the RSI doing that 70% thing again?’ I went to grad school for this.”
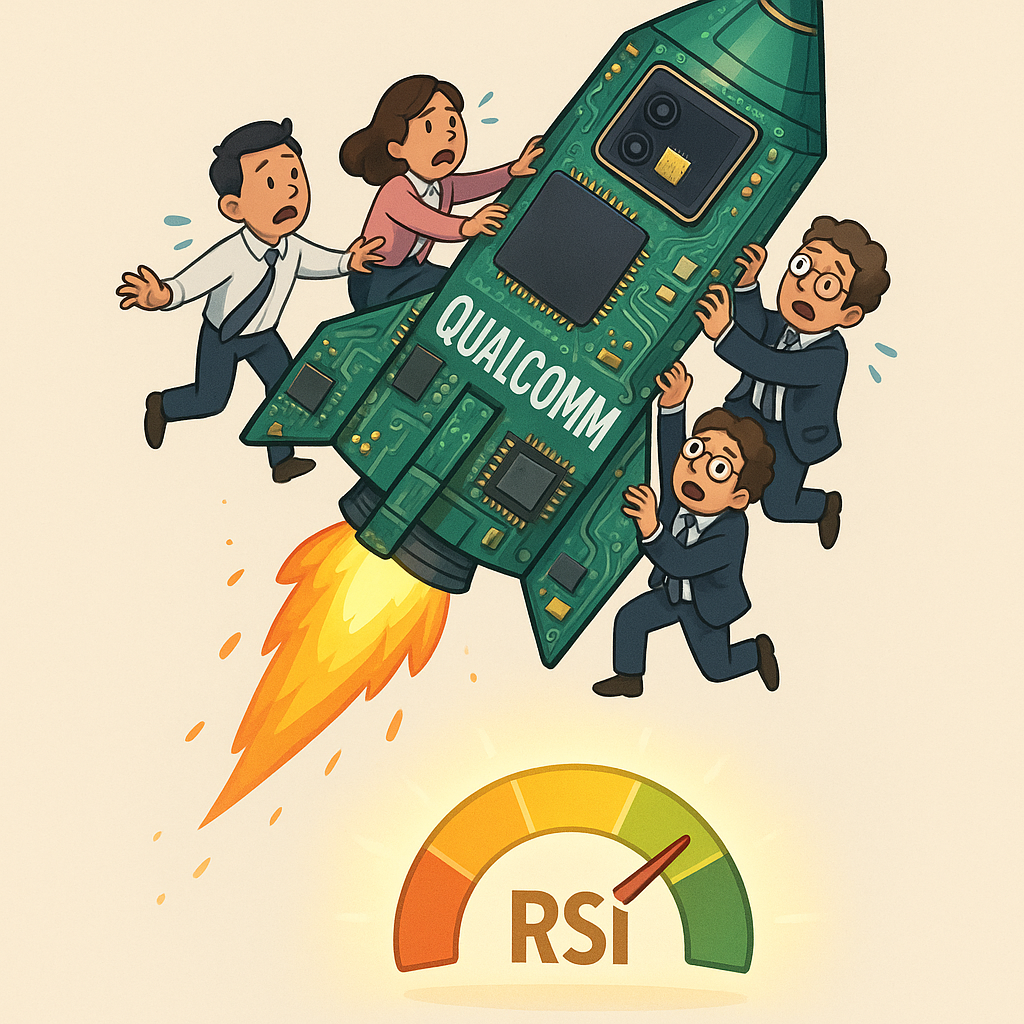
Chasing historical RSI patterns is hardly new. Every few years, a chart resurfaces showing that the last time Some Stock did This Thing, it went vertical shortly after. Omitting, of course, all the other times the same pattern appeared and the only rally was in your stress levels. The current Qualcomm moment just happens to coincide with peak AI-everything, where any ticker even vaguely touching semiconductors gets treated like a lottery ticket printed directly by NVIDIA.
Crypto and NFT traders, always eager to diversify into new, exciting ways to lose money, are starting to eye Qualcomm like it’s a large-cap altcoin with better branding. “Wait, so this is like a token but with dividends, and the devs are, like, actual engineers?” one ex-DeFi degenerate reportedly said while opening his first traditional brokerage account. “And people use the product in real life? That sounds… bullish?”
Technical maximalists are now arguing that Qualcomm’s RSI is simply another on-chain signal — the “chain” in this case being the New York Stock Exchange, a very old and inefficient L1 where blocks are settled with coffee and yelling. “In crypto we had MACD crossovers, golden crosses, death crosses,” explained a Telegram group admin. “Now we respect the Qualcomm RSI cross. Same religion, different ticker.”
As the mania builds, risk disclosures are once again relegated to the financial equivalent of the Marvel post-credit scene: technically crucial, universally ignored. Buried at the bottom of one research note: “Past performance of Qualcomm’s RSI is not indicative of future results, especially if we’re all collectively losing our minds again.” By then, of course, everyone has already screenshotted the price target and moved on.
“We are in the golden age of one-chart investing,” said a sardonic independent advisor from, coincidentally, a server farm in a New Jersey basement. “Nobody cares about 10-Ks, cash flow, or competitive moats. They want a single image they can post in a group chat with the caption: ‘Literally all you need to know.’ Qualcomm’s latest RSI move is the Mona Lisa of that genre.”
In theory, the story ends one of two ways:
- Qualcomm rallies 70% again, the RSI cult is vindicated, and technical analysis TikTok becomes insufferable for the next decade.
- Qualcomm doesn’t, everyone discovers the concept of variance, and the same people who swore by RSI will pivot to a new sacred indicator by April.
Both outcomes share one constant: the Investing.com headline will live on in screenshots, forever cited without context as proof that if you just stare at squiggly lines long enough, you never have to think about fundamentals again.
Until then, Qualcomm’s RSI is less a technical measure and more a Rorschach test for the market’s collective delusion. Bulls see another 70% upside. Bears see an overbought trap. And somewhere in the middle, the company is still just trying to sell more chips while the rest of us argue over how steeply the purple line is pointing.